
Is Massachusetts getting warmer? Wetter? There has been a lot of talk about global warming, climate change, its causes and its implications for our future. But, how has climate change affected Massachusetts?
To really identify climate change, one needs a consistent set of data, taken reliably, continuously, and consistently at the same location over a number of decades. For our post today, we consider the data set collected by the Blue Hill Meteorological Observatory, based in Milton Massachusetts, which owns the oldest continuous weather record in North America.
The Observatory dates to its founding by Abbott Lawrence Rotch in 1885. Located atop the Great Blue Hill in Milton, Massachusetts, the Observatory, from its vantage point 635 feet above sea level, offers great visibility. On clear days, New Hampshire’s Monadnock region, some 60 miles away, can be seen to the northwest. And, the Blue Hill is the highest US peak on the east coast where the Atlantic Ocean can still be seen. What’s even better is that the Blue Hill Meteorological Observation provides free access to the weather it has observed and recorded atop the Great Blue Hill since 1891.
So, what does the information tell us?
Massachusetts is getting warmer. Period. No question.
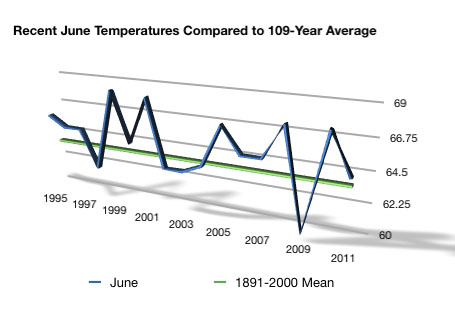
When you first start comparing average monthly temperatures for June, for the years 1995-2011, some variation from year to year emerges. This is expected. During those 17 years, however, the average temperature for June was 1.4 degrees warmer than the 109-year average observed from 1891-2000. And, only two of those years were more than 1 degree colder than the average. 1999 saw the warmest June since record-keeping began at the Great Blue Hill, 4.7 degrees above average. Just two years later, in 2001, the second-warmest June ever was recorded. In fact, 2008 and 2010 are also mentioned in the record books. They are tied for the 8th warmest June ever recorded. Did we have any cold Junes in those 17 years? Yes, one – you may remember that cold, damp June of 2009? Well, it really wasn’t that odd. That was the tenth coldest June since 1891; nine other Junes were colder.
But, maybe June was just an odd month, for the last 17 years. So, what happens when you look at full-year data for the same 17 years between 1995 and 2011? Bad news, it gets worse.
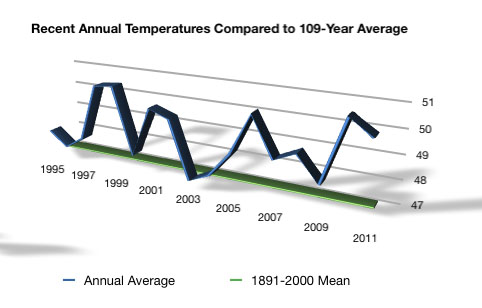
Not one year during that period fell below the 109-year average for annual temperature. 2003 came the closest, but was still 0.1 degrees above the average. In fact, the average annual temperature for the 109 years between 1891 and 2000 was 47.4 degrees, while the average for the last 17 years was nearly two degrees warmer, 49.2 degrees. And, seven of those years fall within the top ten warmest years ever recorded. Consider that 2010, 1999, and 1998 were the first, second, and third warmest years ever – in that order. This is consistent with the US Environmental Protection Agency‘s finding that average annual temperatures in the Northeast have risen by 2 degrees since 1970.
But the snow keeps falling – even on Halloween
It still snows; so, it can’t be getting that much warmer, right? Last year, we had our snowiest October ever in Eastern Massachusetts. Remember those power outages caused by falling tree limbs? A look at the chart below shows that average annual snowfalls vary much more widely, yes. But, maybe that’s the point – snowfall, and maybe precipitation in general is getting harder to predict. The extremes are becoming more common as the storms grow stronger. Sorry, meteorologists.
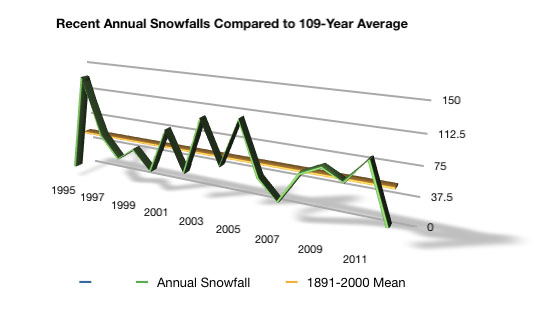
In the 18 winters since 1994-95, six have been remarkable in that they have ranked in the top ten snowiest, or least snowiest, seasons ever. In 1994-95, the Blue Hill Meteorological Observatory observed just 17.9 inches of snow for the entire season, which remains the second least snowiest season recorded since 1891. But, then, during the following winter, in 1995-96, the area saw a whopping 144.4 inches of snow, the greatest amount of snowfall since 1891. 2002-2003 and 2004-2005 were both very snowy seasons as well and remain on the area’s top five ‘snowiest’ lists. And, then a couple of years later, in 2006-2007, the area saw just 27.6 inches of snow, the lowest amount since Clinton’s first term. Last winter, 2011-12 was unusual, however. Officially, it is the fifth least snowy season ever recorded. This ranking quickly drops to the second-least snowiest if you leave off that odd October storm that dropped more than a third of last winter’s total snowfall before Halloween even came.
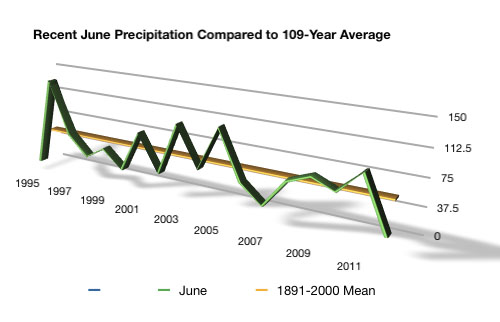
So, if the snow is becoming less predictable, what about total precipitation? This, too, seems to follow a similar pattern. The storms, and the precipitation, are becoming more severe, and less predictable. In the last 17 Junes since 1995, we’ve experienced the wettest June since record-keeping began. And, it wasn’t that cold, wet June of 2009, which, from a precipitation perspective, was surprisingly average. The wettest June since 1891 was in 1998, when the area received a massive 17.3 inches of rain. And, again, back to the extremes – the following year, June 1999 saw almost no rain at all – 0.14 inches, and is recorded as the driest June ever. Precipitation during the following two years, 2000 and 2001, reversed course to again become the 8th and 9th wettest Junes ever. More recently, June 2006 dumped a surprising 12.3 inches of rain in the area and is the third wettest June. Only one year of the last 17, 2005, was among the driest ever – and was just the 10th driest at that.
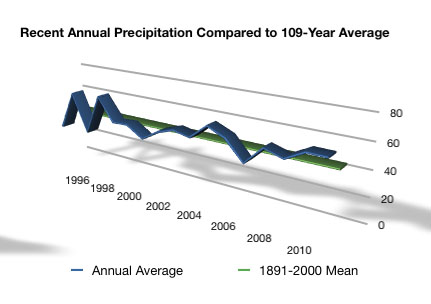
Admittedly, looking at data from an annual perspective smooths the extremes out some, but not enough to disregard the idea that extremes are becoming the norm. Since 1995, Massachusetts has seen six of its wettest years on record. 1998 is on record as being the wettest year ever recorded, at 71 inches of precipitation. And 1996, at 69.4 inches, holds second place. More recently, 2005 saw 66 inches of precipitation in the area and is ranked the third wettest year since 1891. Three other years, 2010, 2011, and 2006 are the region’s sixth, seventh, and eighth wettest years, respectively. None of the seventeen years since 1995 have been among the ten driest years ever. Indeed, the US EPA even recognizes that precipitation in New England is increasingly falling as rain, not snow.
Obviously, complete year data for 2012 data are still not available. But, through May, average temperatures for all five months have been significantly above normal. The average temperature for January was 31.2 degrees, 5.6 degrees above normal. February and March were the second warmest ever recorded. April was recorded as the third warmest ever, and May, the sixth warmest since 1891.
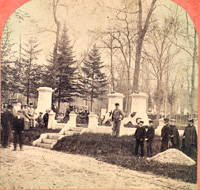
So, these data are just that – data. What impact do these graphs and records have on nature, on something we can see? Consider the photographs below. The first shows Lowell Cemetery on May 30, 2023. The second shows the same location, in Lowell Cemetery, on the same day in 1868.


The fact that climate change is occurring is hard, if not impossible, to deny. The cause, whether due to overuse of fossil fuels or to natural, cyclical fluctuations in climate can be and is debated. A 2009 report issued by the US Global Change Research Project stated that, by the end of this century, residents of New Hampshire may be experiencing summers similar to those experienced by North Carolinians today. The same research predicts that Boston, which averaged triple digit heat (100 degrees of higher) just one day a year between 1961 and 1990, will experience some 24 days of temperatures exceeding the 100 degree mark by the 2070’s. The effects of climate change will impact many aspects of daily life for New Englanders in the decades to come. More frequent, and more severe floods are expected. The hot summer days will lead to increased air pollution and falling air quality. In agriculture, global warming threatens New Hampshire’s maple syrup industry as well as the cranberry growers of southeastern Massachusetts. And, of course, one of the most threatened New England industries is the winter recreation industry, which today generates some $7.6 billion annually. Less snow and warmer days seriously threatens traditional cold weather activities like skiing, snowmobiling, and ice skating.
The data are undeniable. Massachusetts is growing warmer, and wetter. Its weather is growing more violent and unpredictable. Global warming is a reality and its causes and implications must be fully understood. If it cannot be stopped, there’s still time to minimize its impact.
Related articles
- Mass. records warmest ever March-May period (boston.com)
- May 2012 global temperatures second warmest on record (sciencedaily.com)

Excellent piece (as usual); — I particularly loved the 1868 and 2005 cemetery photo comparison.
The cemetery photos are intriguing, and quite interesting evidence in showing the effects of global warming over a 140-year (or so) period.
I think we ARE getting warmer– we’re still coming out of a mini “ice age” that occurred in the Middle Ages, and began to end in the 19th century. I find weather fascinating, and loved this!
Hi Karen – thanks! I’ve been following your series on the Ancestry DNA testing – very interesting!
I need to confirm your fears. In Germany, we see this trend. The weather is unfortunately more and more crazy. Always hotter summer, always colder winters.